
Key takeaways
- Agree KPI definitions, acceptance criteria and a rough dashboard sketch before development so the team understands both the numbers and the user experience.
- Use shared models, build standards and controlled releases to make reporting consistent and maintainable as the team grows.
- Assign owners, monitor production health and review business use so reports stay trustworthy and useful after launch.
When you build a Power BI reporting solution for a company of 1,400 people, scale makes small inconsistencies expensive. Two developers can work from the same data and produce reports that feel completely different. Users then have to learn each developer’s habits before they can understand the business.
The bigger the audience, the more expensive every bad habit becomes.
The problem becomes more serious when the differences reach the numbers. One report uses the order date; another uses the invoice date. One excludes canceled transactions; another includes them. Both calculations may be technically valid, but leadership cannot use them confidently until someone explains what each one means.
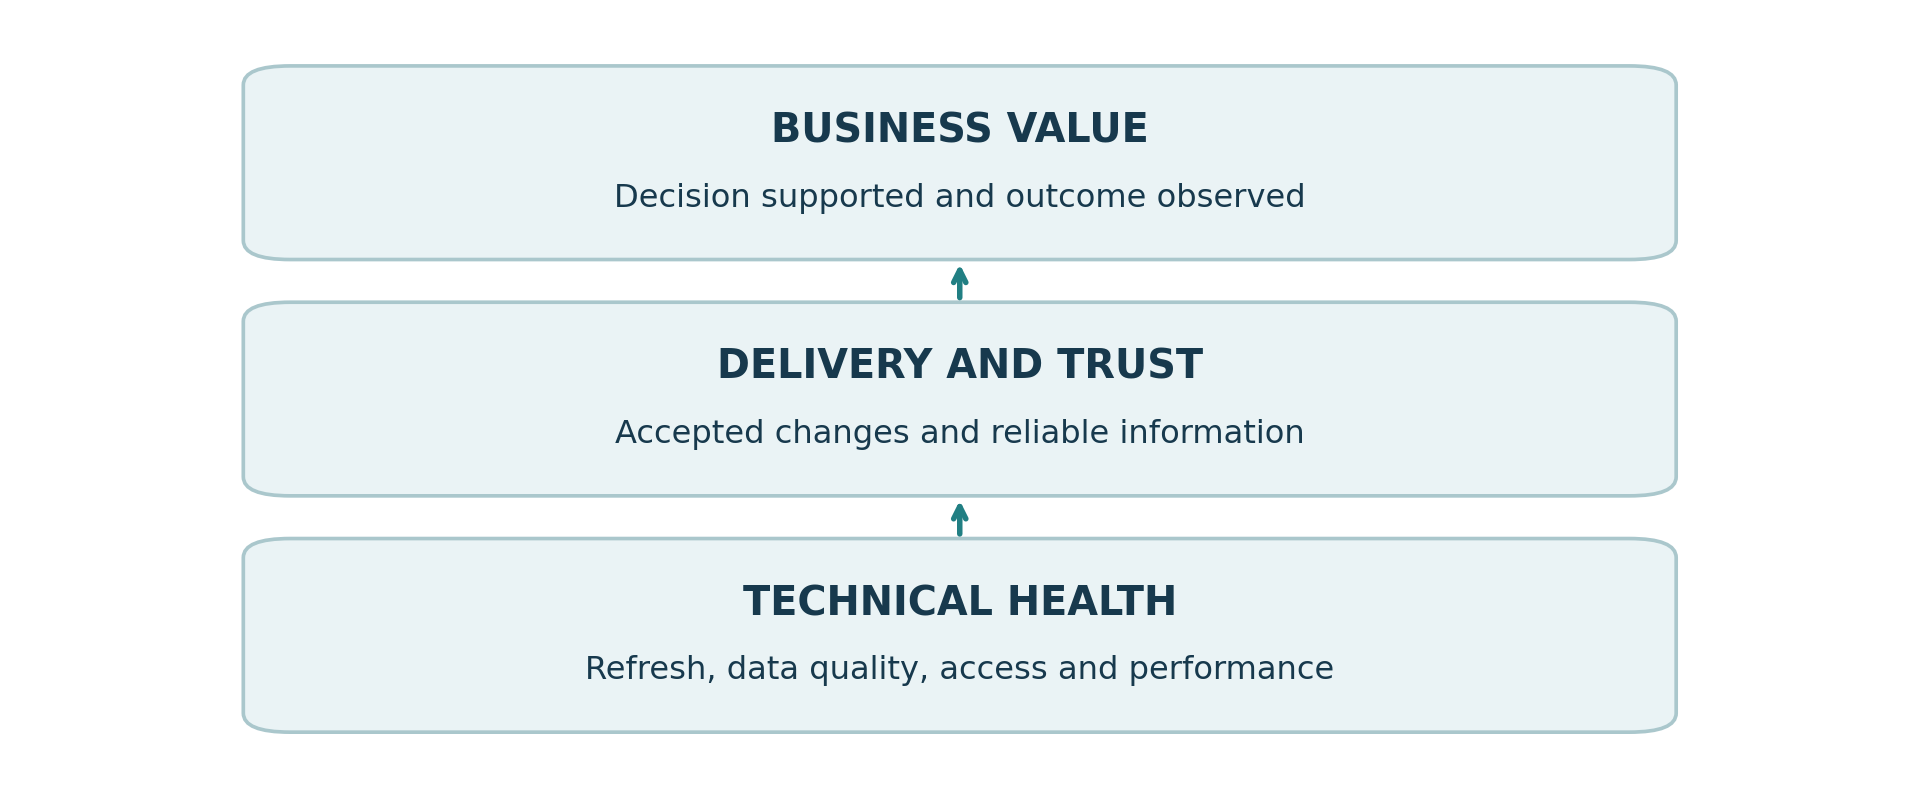
Scaling business intelligence requires a repeatable way to turn business questions into trusted decisions. The foundation is four points of control: requirements, build standards, release discipline and quality checks. To sustain that foundation, managers also need clear ownership, sensible prioritization and a plan for what happens after launch.
The goal is to make good delivery repeatable without turning every dashboard into an administrative exercise. Controls should be proportionate to the importance of the decision, the sensitivity of the data and the consequences of getting it wrong.
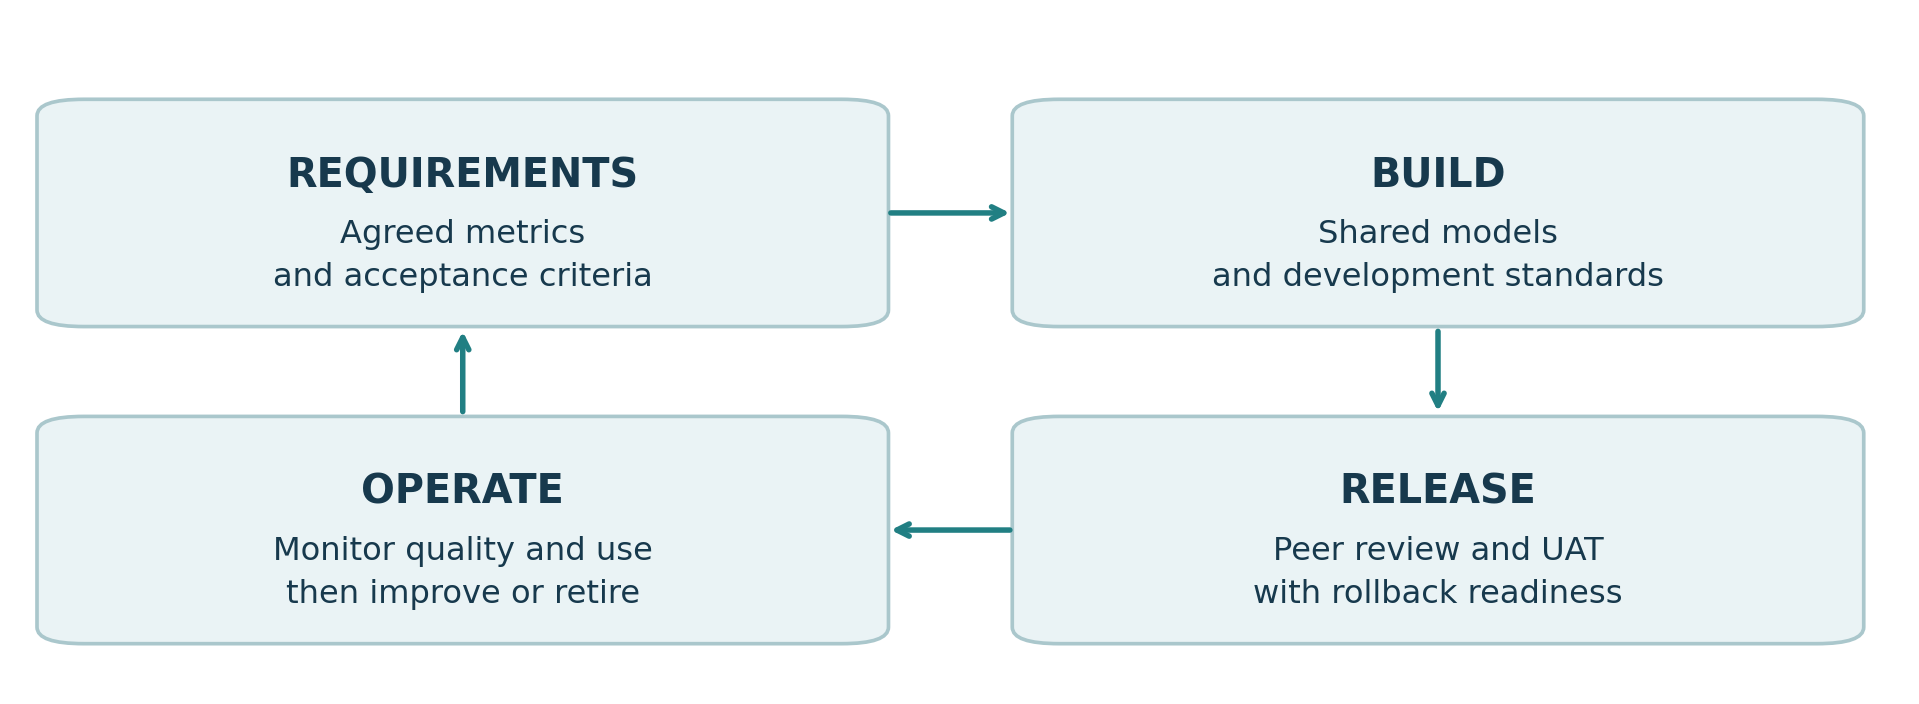
1. Define the decision before the dashboard
Most reporting requests begin with a proposed output: a dashboard, an export or another page. A BI manager should first ask what decision the output will support, who will make that decision and how often they need to make it. These answers determine the required detail, refresh frequency and level of assurance.
Turn requirements into a metric agreement
Use a data dictionary alongside a business metric agreement. The dictionary explains the fields; the agreement explains how each KPI is calculated, interpreted and approved. Add a rough dashboard sketch, where feasible, to show how users will explore those metrics.
For each KPI, capture its business purpose, definition, formula, source tables and columns, reporting grain, applicable date field, time zone and filters. Record how blanks, duplicates, cancellations and late corrections are handled. Name the business owner who approves the definition and the technical owner who maintains the implementation.
Consider a marketing pipeline metric. “Opportunity amount” is incomplete unless the team agrees which opportunities qualify, which date assigns them to a month, which currency is used and whether the same opportunity can appear through several campaigns. These choices should be visible before a developer writes DAX.
| Requirement | Illustrative agreement |
|---|---|
| Decision | Assess whether marketing is contributing sufficient new pipeline. |
| Population and grain | One record per qualifying opportunity; prevent duplication across campaigns. |
| Reporting date | Use opportunity creation date in the agreed reporting time zone. |
| Value and exclusions | Use the approved currency basis and document excluded business categories. |
| Acceptance evidence | Reconcile the total and an agreed sample of opportunity IDs to the source. |
Agree the evidence for acceptance at the same time as the definition. An example total, a list of sample records and an explanation of known exceptions give developers something concrete to validate. A screenshot alone rarely provides enough detail to investigate a disagreement.
Keep the agreement alive. When a stakeholder changes the definition, record the effective date and decide whether historical periods must be recalculated. Otherwise, a legitimate business change can look like a reporting defect.
Sketch the experience alongside the definitions
The data dictionary tells developers what the numbers mean. A rough sketch shows what users actually need to see. A whiteboard drawing, a slide or a simple wireframe is enough to agree the page structure before investing in a polished design.
Include the intended audience, KPI positions, chart types, filters, navigation and any detail view or drill-through. Walk through a realistic question with the user: which result would they check first, which filter would they change, and what action would follow? Use the same metric names as the dictionary so the layout and calculations stay connected.
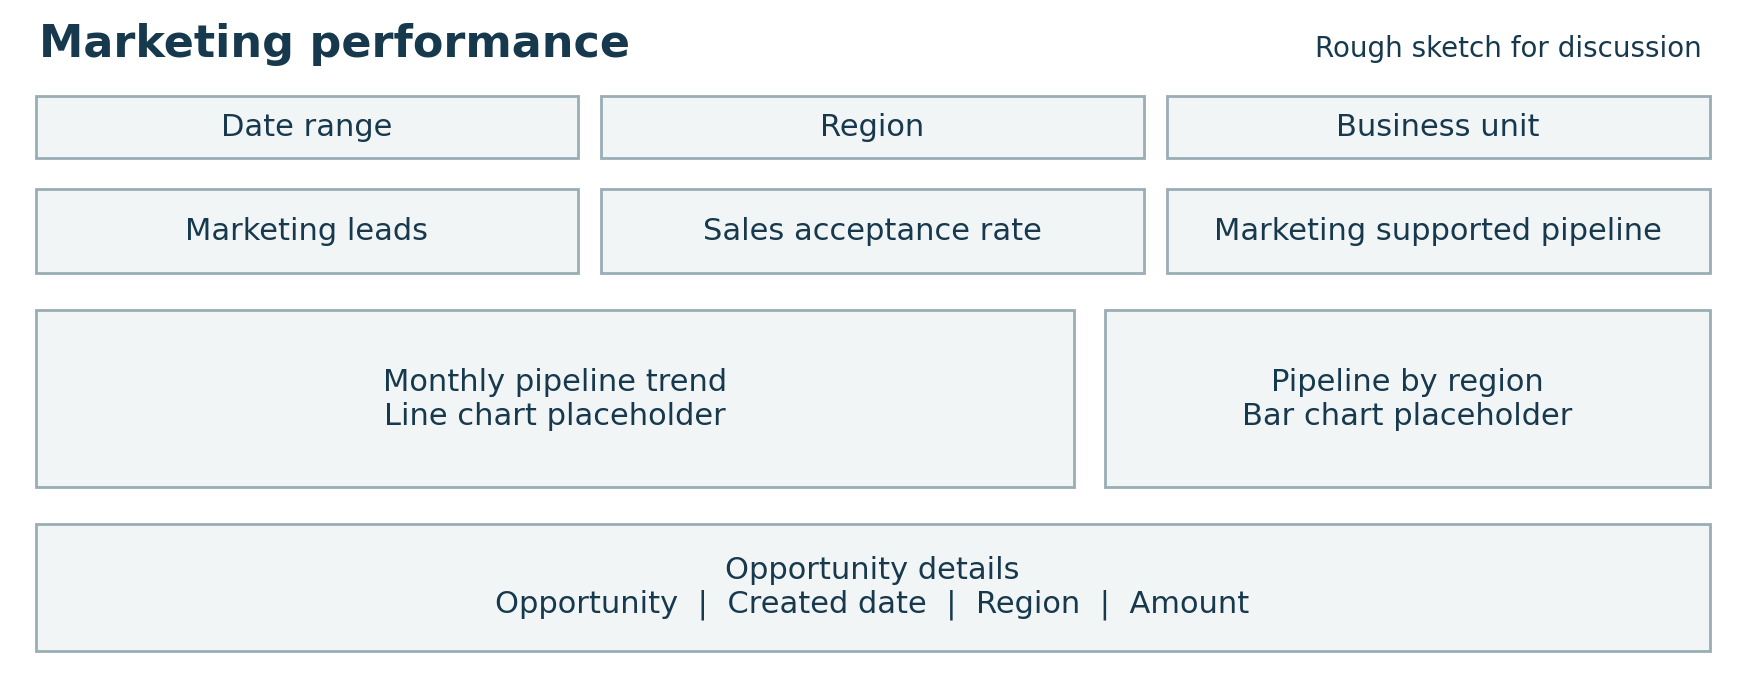
This sketch is a discussion aid, not a fixed visual specification. Use placeholders rather than invented results, confirm priorities with the user and revise it when requirements change. If a full sketch is impractical, agree at least a simple page outline and the main user journey.
2. Standardize the build and reuse the logic
A development standard should exist before several developers start building independently. It needs to answer routine questions about naming, measure organization, model relationships, visual formatting, navigation and conditional formatting. A short standard that the team actually applies is more useful than an exhaustive document nobody opens.
Not during. Not after. Before you write a single DAX line.
Separate reusable calculations from presentation
Consistent colors do not resolve inconsistent calculations. Where reports share business logic, develop a governed semantic model that holds reusable measures, relationships and access rules. Reports can then serve different audiences while using the same approved definitions.
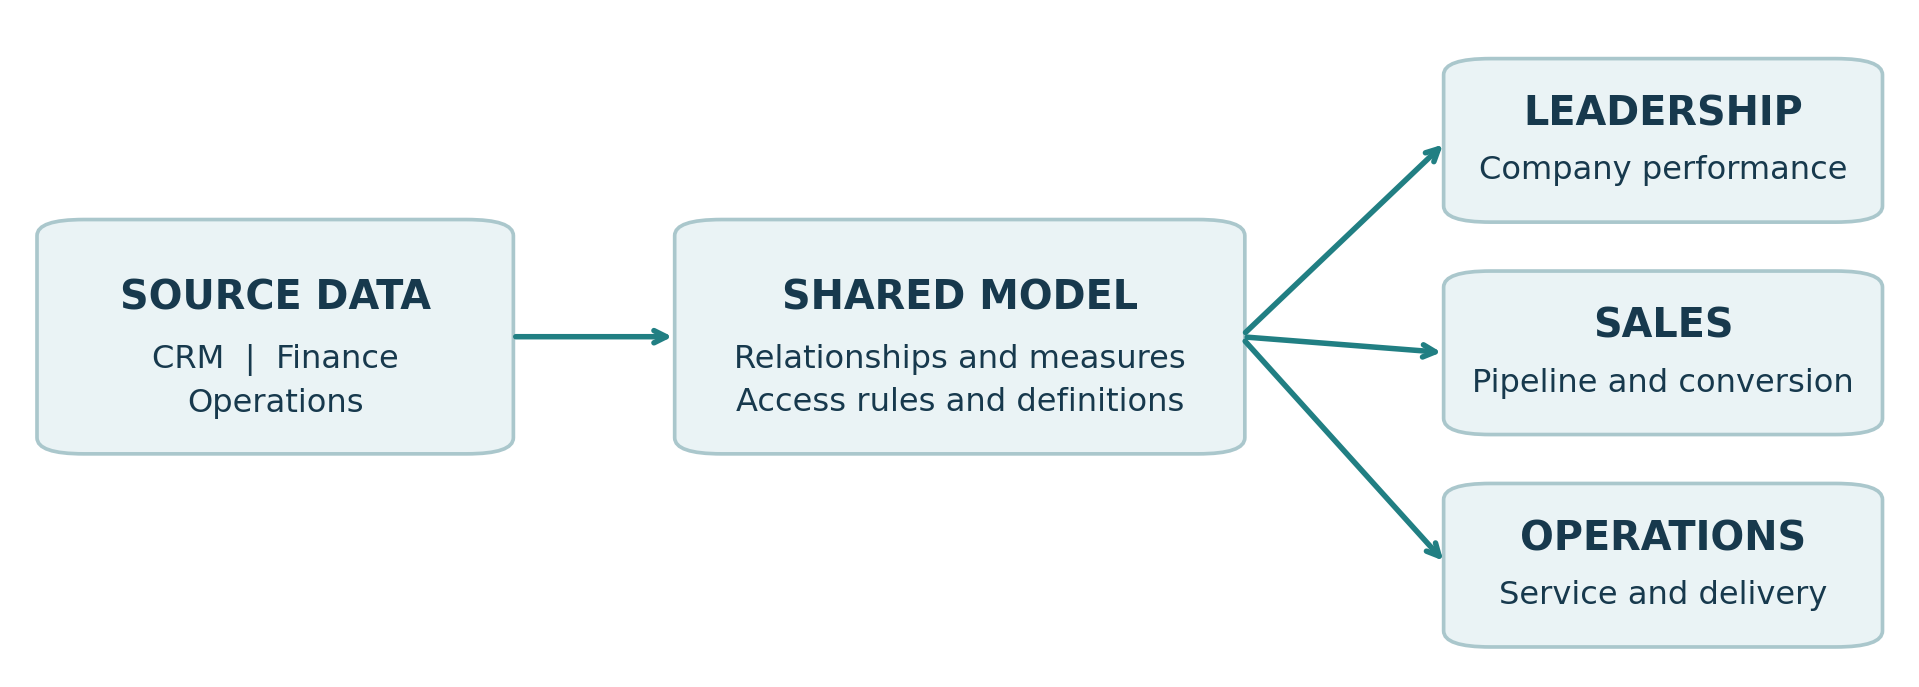
This does not mean forcing every domain into one enormous model. Finance and operations may need different grains, refresh patterns or access boundaries. Reuse logic where the business meaning is shared; keep separate models where their responsibilities are genuinely different.
Make the standard practical
Define how developers name measures, use display folders, format dates and currencies, and explain calculations that need interpretation. Where calculation groups are used, document their purpose and interactions. Specify approved color meanings, readable font sizes and sensible defaults, while allowing the chart type to suit the question.
Include performance in the standard. Review unnecessary columns, expensive calculations, excessive visuals and refresh design before they become user complaints. Test the report with realistic data volumes and access permissions. A page that loads quickly for a developer may behave differently for its intended audience.
3. Make releases controlled and recoverable
One wrong publish to production is all it takes to understand why the discipline exists.
A reliable release process answers four questions: what changed, who checked it, who accepted it and how the team will recover if it fails. These answers should be available without searching a developer’s messages or guessing which file is the latest.
Use version control for the assets the team can meaningfully track and review. Where file formats limit comparison, keep a controlled version history alongside a change log and the supporting definitions. A folder full of files named “final” is not a release process.
Separate development, testing and production. Validate the data connections, refresh settings and permissions in each environment. Avoid a last-minute production edit that exists nowhere else; any emergency correction should return through the controlled process so environments do not drift apart.
Give UAT a business purpose
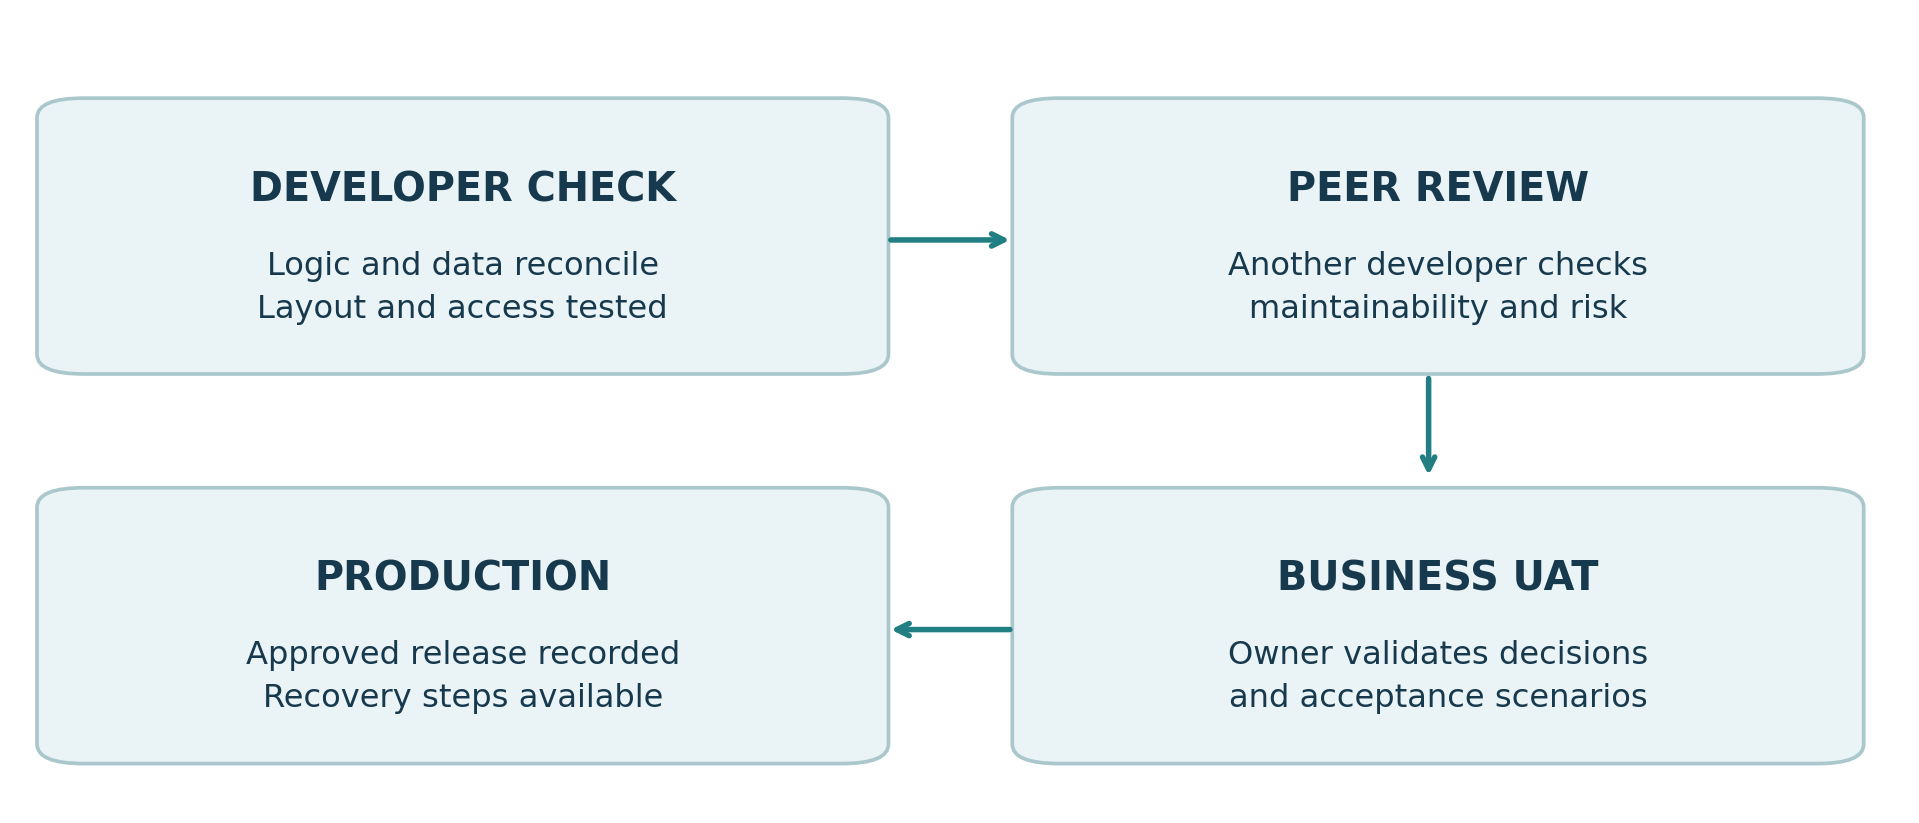
User Acceptance Testing should confirm that the report supports the agreed decisions and business rules. Developers should resolve obvious calculation, layout and navigation defects before asking business users to test. Acceptance should come from a named owner and refer to recorded scenarios, rather than a vague “looks fine” message.
A sensible release record contains the change summary, test evidence, business approval, deployment owner and recovery steps. Retain a known working version and understand any dependencies that would also need to be restored. Reverting a report alone may not reverse a changed data structure.
The cost of discipline is one hour. The cost of skipping is your credibility.
4. Check quality before users have to find defects
A developer can spend three days on a dashboard and have a stakeholder reject it in ten minutes.
A pre-UAT checklist should cover appearance, data correctness, security and operational readiness. Make the reusable checklist a baseline, then add project-specific checks for the decisions and risks involved.
| Area | Evidence to check before UAT |
|---|---|
| Data accuracy | Totals and sample records reconcile; duplicates, blanks, date boundaries and filter interactions are tested. |
| User experience | Labels are readable; visuals align; navigation, drill-through and slicer defaults behave as intended. |
| Standards and performance | Approved metric logic and theme are used; page response and refresh duration are acceptable for the use case. |
| Access and readiness | Representative users see only permitted data; refresh ownership, support contacts and known limitations are recorded. |
Automate repeatable checks where practical, such as duplicate-key detection, missing dates and unexpected row-count changes. Keep human review for business meaning and usability. Treat a passed checklist as evidence of specific checks, rather than a guarantee that no defect can exist.
5. Put ownership behind scaling business intelligence
Four well-designed controls can still fail when no one owns the business definition or when every request becomes urgent. A BI manager needs to manage demand as deliberately as development. Otherwise, the team becomes an order queue for whichever stakeholder follows up most often.
Make responsibilities explicit
The business owner approves KPI meaning and usefulness. BI owns the implementation and delivery process; source-system owners resolve upstream data issues. Name a backup for critical products so support does not depend on one person.
Create one route for incoming requests
Use a common intake that records the business problem, intended users, decision frequency, required date and reason for that date. Ask whether an existing report already addresses the need. Sometimes the fastest solution is better navigation or a small enhancement, rather than another dashboard.
Prioritize requests using business impact, urgency, data readiness, implementation effort and ongoing support cost. Discuss trade-offs openly with stakeholders. A deadline tied to a regulatory submission or a board decision deserves different treatment from a preference for a new color scheme.
Separate production incidents from planned improvements and exploratory analysis. Protect some capacity for maintenance, documentation and learning. The allocation can change with demand; the important point is to make the trade-off visible instead of allowing support work to consume the roadmap silently.
Give self-service clear boundaries
Give business teams governed datasets, clear definitions and examples for self-service. Agree who owns and validates departmental reports, and when an exploratory report must enter the supported production process.
6. Run the report as a business service
Publishing is the beginning of operational responsibility. A report can refresh successfully while showing incomplete data, outdated definitions or a result nobody uses. Production health therefore needs to cover both technical operation and business usefulness.
Monitor the conditions that make numbers trustworthy
For each important reporting product, define expected data freshness, refresh completion and a small set of data-quality checks. A successful refresh with zero transactions may deserve more attention than a failed refresh with an obvious error message. Track the condition the user depends on, not just whether a scheduled job finished.
Match expectations to the decision cycle. A monthly management pack and a daily operations report need different support arrangements. Agree what happens when data arrives late, how users will know it is stale and which team investigates first. State the last successful data update clearly where users can find it.
Maintain a short incident record covering the symptom, affected users, cause, resolution and preventive action. Repeated incidents are a signal to improve the model, upstream process or monitoring. The aim is to reduce recurrence and recovery time, rather than celebrate repeated emergency fixes.
Measure whether the product changes work
Report counts and page views show activity, but they do not establish value on their own. Ask where a report is used, which manual task it replaces and what action follows when a KPI moves. A dashboard that supports a weekly allocation decision may be valuable even if its audience is small.
| Management question | Useful measure or evidence |
|---|---|
| Are deliveries predictable? | Time from an agreed requirement to an accepted release, compared across similar work. |
| Are users receiving reliable information? | Freshness against the agreed schedule and material defects found after release. |
| Is the product used for its intended purpose? | Target-user activity combined with feedback from the decision meeting or workflow. |
| Is the reporting estate sustainable? | Support effort, duplicate reports and the number of products without an active owner. |
Retire reports with the same care used to launch them
Review unused, duplicated and ownerless reports periodically. Check dependencies and speak to the business owner before retirement, then communicate the replacement or archive location. Every supported report consumes attention; removing obsolete products creates capacity for work that still matters.
7. Develop a team that can support its own growth
Pair developers on unfamiliar models and rotate release reviewers. Ask a backup owner to trace a critical measure from source to visual; this reveals gaps that documentation alone can hide.
Keep a short support guide for each important product. It should explain the upstream dependencies, refresh sequence, access process, common failure symptoms and escalation contacts. Include enough context for a colleague to investigate safely without reproducing every development conversation.
Onboarding should end with a small supervised change that follows the normal process. The new colleague reads the definition, updates the implementation, gathers evidence and observes acceptance. This tests whether the standards are usable and gives the manager a clearer view of where coaching is needed.
Encourage developers to question ambiguous requirements and suggest simpler visuals or reused datasets. After an incident, examine the missing control and make it safe to raise uncertainty early.
8. Manage the cost of keeping reports alive
The build effort is only part of a reporting product’s cost. Refreshing data, maintaining credentials, answering questions, adapting to source changes and investigating discrepancies all consume capacity after launch. A request that takes two days to build may create a continuing support obligation for years.
Assess required data volume, history, freshness and access before accepting a new product. Reuse existing models where appropriate. Agree refresh frequency around the decision cycle instead of assuming that more frequent updates always add value.
Track recurring support effort to identify avoidable work. Repeated manual corrections, exports or performance complaints may justify redesigning a product rather than adding another patch.
Make technical debt visible in the backlog. Describe the business consequence of postponing it: slower releases, fragile refreshes, duplicated definitions or dependence on one developer. This gives stakeholders a reason to fund maintenance and helps the team compare it fairly with new features.
9. Use disagreements about numbers to strengthen the system
Imagine that the sales dashboard shows a lower pipeline value than the CRM export. This is an illustrative scenario, but it captures a common management challenge: the stakeholder wants a corrected number immediately, while the team does not yet know whether the difference is an error.
Start by agreeing the comparison. Confirm the reporting period, refresh time, currency, included records and date field. Compare opportunity identifiers before changing the measure. A total can reveal that something differs; a record-level comparison usually provides a better route to understanding why.
Suppose the unmatched records are revisions excluded by the approved metric agreement. The dashboard may be correct, but its label or explanation may be insufficient. Explain the difference and decide whether users also need a separate view. If the exclusion was never approved, return the definition to the business owner instead of silently choosing a rule.
If the investigation finds a genuine defect, correct it through the controlled release process, check affected periods and communicate the impact. Add a regression check that would catch the same failure next time. The immediate repair restores the number; the preventive action improves the function.
Start with a manageable 90-day rollout
Introducing every control at once can overwhelm a team that is already delivering. Start with one important reporting product and use it to test the operating approach. Choose something with an engaged business owner, meaningful decisions and enough complexity to expose weaknesses in the current process.
| Period | Focus | Concrete outcome |
|---|---|---|
| Days 1 to 30 | Understand the current estate and establish definitions. | Inventory important reports; identify owners; pilot a metric agreement and request intake. |
| Days 31 to 60 | Make delivery repeatable on the pilot. | Apply a starter report and build standard; introduce peer review, pre-UAT checks and release evidence. |
| Days 61 to 90 | Close the operational loop and extend carefully. | Monitor freshness and use; review incidents; resolve duplicate reports; refine the process before wider adoption. |
Keep the minimum set of working artifacts
Maintain a metric agreement and rough sketch for each product, supported by a reusable development standard, quality checklist and release record. A simple product register should name the owner, audience, freshness expectation and review date. Reference each definition from one maintained location.
Build trust through predictable behavior
When demand increases, a developer leaves or a number is challenged, can the team explain the definition, trace the source and reproduce the result? Can someone other than the original developer support the product? These questions reveal whether the operating approach works.
Scale exposes every shortcut.
If you are looking to build or sharpen these skills, our Introduction to Power BI training covers data modeling, DAX and dashboard design in depth.
Want to build AI agents that can reason, plan, and execute autonomously?
Learn more